To facilitate analysis and interpretation of single-cell data by users without bioinformatics expertise, we present SCelVis, a flexible, interactive and user-friendly app for web-based visualization of pre-processed single-cell data.
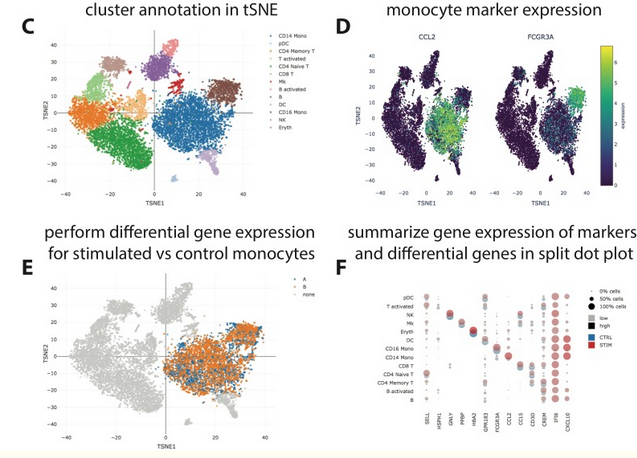
With SCelViz Users can survey multiple interactive visualizations of their single cell expression data and cell annotation, define cell groups by filtering or manual selection and perform differential gene expression, and download raw or processed data for further offline analysis. SCelVis can be run both on the desktop and cloud systems, accepts input from local and various remote sources using standard and open protocols, and allows for hosting data in the cloud and locally. We test and validate our visualization using publicly available scRNA-seq data.
SCelVis is implemented in Python using Dash by Plotly. It is available as a standalone application as a Python package, via Conda/Bioconda and as a Docker image. All components are available as open source under the permissive MIT license and are based on open standards and interfaces, enabling further development and integration with third party pipelines and analysis components.
Exploration of Single Cell Data
Access
The source code is available under the permissive MIT license on the GitHub repository at https://github.com/bihealth/scelvis, which also contains a tutorial movie and a link to a public demonstration instance. The software can be run both in the cloud and on workstation desktops via Docker. Documentation and tutorials are provided on https://scelvis.readthedocs.io.
Related Publications
Obermayer, B.; Holtgrewe, M.; Nieminen, M.; Messerschmidt, C.; Beule, D. SCelVis: Exploratory Single Cell Data Analysis on the Desktop and in the Cloud. PeerJ 2020, 8, e8607. https://doi.org/10.7717/peerj.8607.
Last modified: Feb 4, 2021